From January through October 2025, our research team conducted a comprehensive analysis of rental property repair costs, drawing data from over 680,000 work orders representing $470 million in maintenance spending across major and secondary single-family rental markets. This report aggregates findings from property management companies, landlord surveys, and industry benchmarking studies to provide landlords with accurate repair cost projections and budgeting frameworks for the current market environment.
Average Annual Repair Costs by Category: 2025
Rental property repair costs are broken down into seven primary categories, each encompassing specific types of maintenance and repair work:
- General Maintenance: Structural repairs, drywall patching, water damage remediation, foundation issues, and general property upkeep that maintains the building’s integrity and appearance.
- Plumbing: Water line repairs, drain cleaning, water heater maintenance and replacement, sewer backup remediation, fixture repairs, and leak detection and repair.
- HVAC: Heating and air conditioning system repairs, ductwork maintenance, filter replacements, system tune-ups, and complete unit replacements when necessary.
- Appliances: Repair and replacement of tenant-used appliances, including refrigerators, dishwashers, washing machines, dryers, garbage disposals, and built-in microwave units.
- Electrical & Lighting: Outlet repairs, wiring updates, circuit breaker issues, lighting fixture maintenance, ceiling fan installation, and electrical safety upgrades.
- Doors & Windows: Door hardware repairs, lock replacements, window seal maintenance, glass repairs, weatherstripping replacement, and security feature updates.
- Other: Pest control services, miscellaneous repairs not covered by other categories, emergency maintenance calls, and specialized contractor services.
| Repair Category | Annual Cost | Cost Range |
|---|---|---|
| General Maintenance | $1,200 | $800-$1,800 |
| Plumbing | $850 | $500-$1,200 |
| HVAC | $650 | $400-$900 |
| Appliances | $450 | $250-$700 |
| Electrical & Lighting | $300 | $150-$500 |
| Doors & Windows | $250 | $150-$400 |
| Other (Pest, Misc.) | $300 | $200-$500 |
| TOTAL | $4,000 | $2,450-$6,000 |
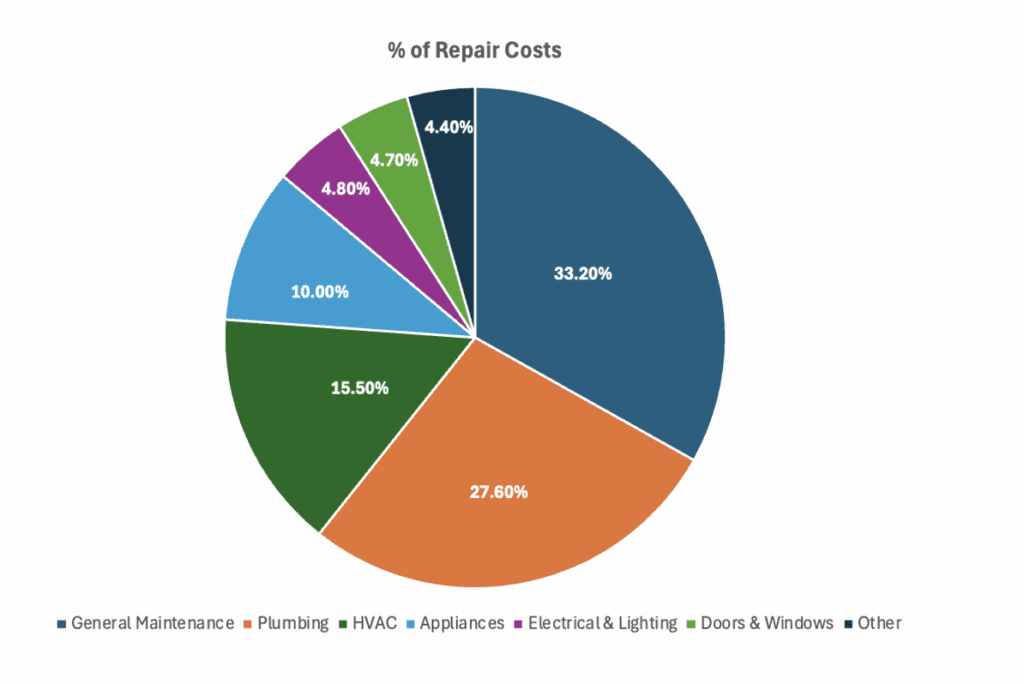
General maintenance emerges as the dominant expense category, encompassing drywall repair, structural issues, and water damage remediation. The median total annual repair cost of $4,000 per property aligns with industry recommendations of budgeting 3-5% of property value for maintenance expenses.
Repair Cost Calculation Methods: 2025
Repair costs are calculated by four primary methods that property management professionals use to estimate annual repair budgets:
- Percentage of Property Value: Estimates repair costs as a set percentage of the property’s total market value for quick, high-level budgeting.
- Per Square Foot: Calculates costs based on the property’s size, offering a standardized estimate regardless of specific conditions.
- Rent Multiplier: Ties repair cost estimates to expected rental income, commonly used by investors to gauge ROI potential.
- Expense Ratio: Estimates repairs as a share of total operating expenses or rental income to plan for ongoing maintenance.
| Calculation Method | Formula | Example (Based on $300k Property) | Best Use Case |
|---|---|---|---|
| Percentage of Property Value | Property Value × 3-5% | $9,000-$15,000 annually | Mid-tier properties, aging homes |
| Per Square Foot | Square Footage × $1.50-$2.50 | $2,700-$4,500 (1,800 sq ft) | Similar construction types |
| Rent Multiplier | Monthly Rent × 4-6 months | $8,000-$12,000 ($2,000 rent) | High-end rentals |
| Expense Ratio | (Annual Rent × 50%) × 15-20% | $1,800-$2,400 ($24k rent) | Multi-property portfolios |
Regional Cost Variations: 2025
Labor shortages and material cost inflation have created significant regional disparities in repair expenses:
| Region | Cost Multiplier | Primary Drivers | Example: Plumbing Repair |
|---|---|---|---|
| Northeast (NYC, Boston) | 1.4×-1.6× | High labor costs, union rates | $950-$1,050 |
| West Coast (CA, WA) | 1.3×-1.5× | Material costs, regulations | $850-$950 |
| Southeast (FL, GA, TX) | 0.9×-1.1× | Competitive markets | $600-$750 |
| Midwest (OH, IL, MI) | 0.8×-1.0× | Lower cost of living | $550-$650 |
Key Takeaways from the Data
General maintenance and plumbing make up over 50% of total repair costs, making them the most critical areas for budgeting. The median annual repair cost per property is $4,000, which aligns with the industry standard of 3-5% of the property value. HVAC ranks third, reflecting increased system replacement costs. Appliance, electrical, and door/window repairs remain smaller but consistent. Coastal and high-cost regions face higher repair multipliers, driven by labor and material expenses. Focusing on the top three categories can significantly reduce overall maintenance spend.
If you’d like to request a PDF copy of this report, you can reach out here.